

MENU
CLIENT ACCESS
MENU
CLIENT ACCESS
Press Releases Archive
NEW YORK, NY – July 19, 2017 – The New York City multifamily market heated up in the second quarter, rebounding sharply from sluggishness earlier in the year as investors grew more confident in the asset class. While sales volume in the City remained lower on a year-over-year basis, the pickup in activity suggests the market may have turned a corner after a period of uncertainty.
Softness in 1Q spilled into April, but sales activity picked up markedly in May and June, culminating with the year’s first $100 million sale, which took place in Brooklyn. On a quarter-over-quarter basis, volume metrics increased in every sub-market, with the City registering the highest amount of transactions since the third quarter of 2016.
“It could be too early to call, but the multifamily market likely troughed in the first quarter,” said Shimon Shkury, President and Founder of Ariel Property Advisors. “The market noticeably bounced back in recent months and we have seen a significant pickup in activity.”
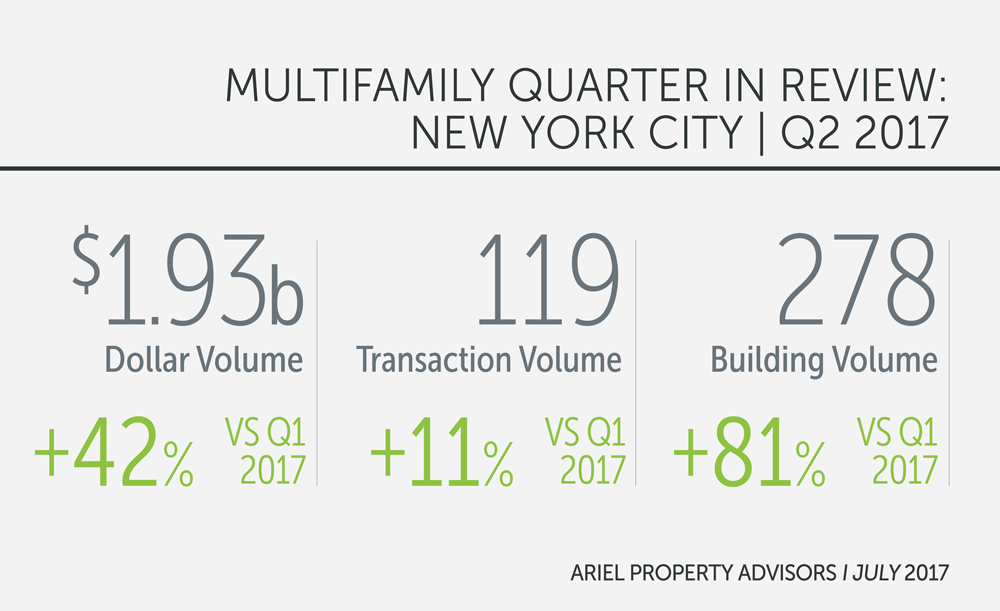
From April through June, New York City saw 119 transactions comprised of 278 buildings totaling $1.93 billion in gross consideration. This represents a 42% increase in dollar volume, an 11% rise in transaction volume, and an 81% jump in building volume compared to 1Q. However, compared to the same quarter last year, 2Q saw dollar volume decline 43%, transaction volume fall 35% and building volume slide 12%.
Pricing in the second quarter appreciated year-over-year across all metrics in The Bronx and Queens, while it continued to soften in Brooklyn. After rising for three straight quarters, Manhattan cap rates bucked the trend and fell 7 basis points to 3.58%, resulting in a nearly 2% rise in property values. The move is consistent with the strengthening of the borough’s other pricing metrics. The Bronx saw prices rise the most rapidly, with price per square foot jumping more than 13% year-over-year to $197.
From a macroeconomic perspective, a robust labor market has the Fed confident that the economy is strong enough to withstand the impact of higher rates. The Fed’s policy-making arm raised short-term interest rates in June, its fourth increase since 2015.
“A pick-up in recent bidding activity on active listings and contract signings suggests things are beginning to turn around,” said Michael A. Tortorici, Executive Vice President at Ariel Property Advisors. “Our baseline expectation is for investment sales volume and pricing to remain stable at current levels through the end of the year.”
Submarket Overview
Manhattan:
Manhattan was energized in 2Q after slumbering during the previous quarter, with the borough leading the City in both dollar and transaction volume, barely edging out Brooklyn in both categories. For the quarter, Manhattan saw $506.97 million in gross consideration trade across 31 transactions.
The largest Manhattan trade during the quarter occurred on the Upper West Side where the Fruchthandler’s FBE Limited purchased a four-building portfolio located at 60-68 West 107th Street for $52 million, or $516 per square foot and $519,000 per unit. Another standout trade from the quarter was 56-58 West 11th Street in Greenwich Village, where the 36-unit elevator building traded for $37.75 million, or $1,389 per square foot, $1,048,611 per unit and a reported capitalization rate of 3.52%.
Manhattan’s trailing 6-month average pricing metrics in the second quarter stood as follows (year-over-year changes): price per square foot at $980 (+1.4%), price per unit at $735,447 (+5.3%), capitalization rate at 3.58% (+1.9%), and gross rent multiple at 20.31 (+3.8%).
Northern Manhattan:
Northern Manhattan saw the strongest quarter-over-quarter gains of any sub-market as four transactions exceeding $20 million pushed dollar, transaction and building volumes to more than double. For 2Q, Northern Manhattan saw $324.02 million in dollar volume from 24 trades, up 181% and 140%, respectively, from 1Q.
A two-building portfolio in Washington Heights located at 385-395 Ft. Washington Avenue that traded in June was the sub-market’s largest transaction of the year so far. The 119-unit mixed-use elevator buildings sold for $40.1 million, or $353 per square foot and $336,975 per unit.
Northern Manhattan’s trailing 6-month average pricing metrics in the second quarter stood as follows (year-over-year changes): price per square foot at $394 (+9.3%), price per unit at $332,825 (+0.6%), capitalization rate at 4.08% (-0.5%), and gross rent multiple at 15.81 (-1.6%).
The Bronx:
The Bronx was the only sub-market to register both quarter-over-quarter and year-over-year increases in dollar volume, despite joining Brooklyn as the only locations to see transactions fall against the previous quarter.
Led by two portfolio deals involving Isaac Kassirer’s Emerald Equity Group, the borough saw 44 buildings sell across 20 transactions totalling $324.54 million in gross consideration. These figures represent a 2% drop in building volume, a 35% decline in transactions and a sub 1% jump in dollar volume quarter-over-quarter. The larger of the aforementioned portfolio sales was the 11-building, 291-unit portfolio in Fordham, which was sold by Prana Associates for $49.3 million, or $189 per square foot.
The other significant portfolio to trade was the six-building, 209-unit package that Pistilli Realty bought for $38.5 million, or $209 per square foot.
The Bronx’s trailing 6-month average pricing metrics in the second quarter stood as follows (year-over-year changes): price per square foot at $197 (+13.3%), price per unit at $174,693 (+11.6%), capitalization rate at 4.92% (+3.1%), and gross rent multiple at 11.82 (+7.6%).
Brooklyn:
Brooklyn fared well in 2Q, and narrowly missed leading New York City in dollar volume for the second straight quarter, thanks in large part to three sales that took place for north of $75 million. For the quarter, Brooklyn saw 29 sales comprised of 90 buildings totalling $502.28 million in gross consideration. These numbers represent a 26% and 76% improvement in dollar and building volume respectively, but a decrease of 9% in transaction volume compared to the previous quarter.
The borough saw the City’s only trade above $100 million this year take place in Sunset Park where a 42-building, 403-unit affordable housing portfolio traded for $100 million, or $281 per square foot. Another notable transaction this quarter was a 161-unit elevator building located at 107 Columbia Heights in Brooklyn Heights that was sold by the Jehovah’s Witnesses for $87.5 million, representing $568 per square foot and $543,478 per unit.
Brooklyn’s trailing 6-month average pricing metrics in the second quarter stood as follows (year-over-year changes): price per square foot at $344 (-9.3%), price per unit at $299,624 (-7.4%), capitalization rate at 4.88% (-10.2%), and gross rent multiple at 15.28 (-7.5%).
Queens:
Queens registered strong gains across the board as a bevy of $10 million transactions and two large portfolio sales boosted the borough’s figures ahead of the previous quarter. For 2Q, Queens saw 15 transactions consisting of 69 buildings trading for $270.62 million in gross consideration. These numbers are a considerable jump from 1Q’s 10 trades involving 14 buildings that amounted to $167.98 million in dollar volume.
The largest transaction in Queens this quarter took place in Astoria, where the Kushner Companies sold a four-building, 154-unit portfolio for $76.25 million, or $617 per square foot.
Queens’ trailing 6-month average pricing metrics in the second quarter stood as follows (year-over-year changes): price per square foot at $377 (+17.5%), price per unit at $286,614 (+8.0%), capitalization rate at 4.31% (+4.9%), and gross rent multiple at 15.16 (+8.3%).
To view the full report, please click here: http://arielpa.nyc/research/report-MFQIR-Q2-2017
For More information, please contact: Shimon Shkury 212.544.9500, ext. 11, sshkury@arielpa.com
Loading...![]()
Ariel Property Advisors is a New York City-based commercial real estate services and advisory company offering expertise in three core areas: Investment Sales, Capital Services and Research & Advisory. Our Investment Sales Group specializes in all major commercial asset types throughout the New York metropolitan area, the Capital Services Group provides clients nationwide with custom-tailored financing solutions and the Research & Advisory team delivers timely market reports, empowering both our professionals and clients. Additionally, our recent strategic partnership with GREA (Global Real Estate Advisors), a nationwide network of independent real estate investment services companies, further expands our reach and capabilities. To learn more, please visit us at arielpa.nyc.


©2026 ARIEL PROPERTY ADVISORS